15% budget drift identified and corrected for a client

Cut through the fog: drive your transport with data

“We can’t explain why our transport budget drifted by 15% this semester.” — Scattered data, opaque flows, invisible levers. If you can’t see what’s happening, you can’t act.

Drive your Supply Chain with facts, not gut feelings

OneChain reporting turns raw data into strategic decisions through concrete use cases:

Forwarder performance: challenge your partners on objective KPIs (service level, transit time compliance, price competitiveness)
Cost per item: combine your business and transport data to calculate your transport cost per piece
Allocation tracking: verify in real time that your volumes match the distribution defined in your tenders
Risk control: track your CO2 emissions and keep an eye on Demurrage & Detention charges
OneChain dashboard — transport cost per piece and CO2 emissions
Focus

Manage your carriers with data, not intuition

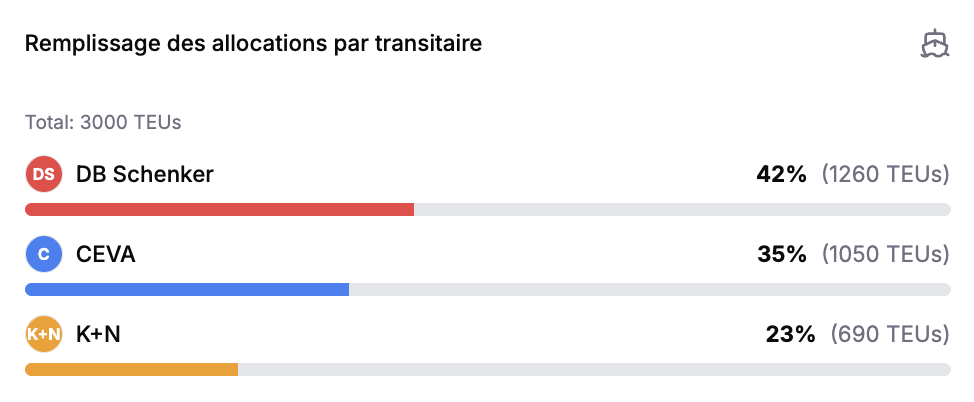
Provider evaluation too often relies on subjective impressions. By centralizing your flows, OneChain turns your operations into indisputable performance indicators:

Responsiveness: response times and rates to pricing requests
Reliability: transit time compliance and competitiveness gaps
Budget accuracy: automatic invoice compliance verification

This visibility enables a fact-based dialogue with your partners. You no longer judge on the latest incident, but on a real trend — driving your entire logistics chain towards excellence.

OneChain dashboard — forwarder performance and savings from competition
Business Case

Know the real transport cost per product

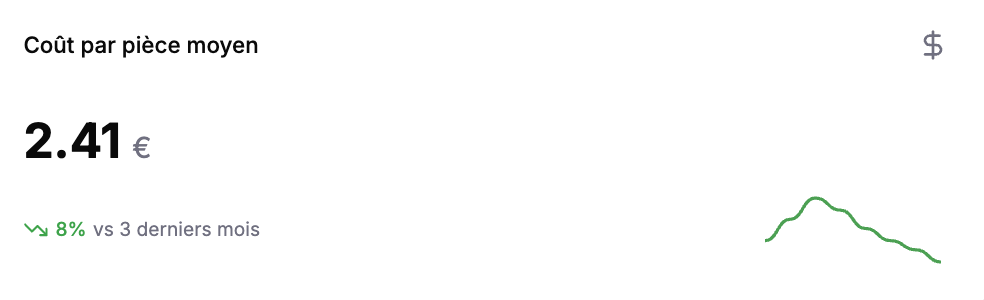
For many importers, the transport budget remains a lump sum that's impossible to break down. Yet without a precise view of the transport cost per piece, the true profitability of a product reference can remain invisible.

By automatically cross-referencing transport invoices with packing lists, OneChain enabled a client to move from a global view to a precise unit-level calculation.

Drift identification: logistics cost went from €1.20 to €4.50 on one reference (underfilled container + excessive air freight)
Financial impact: 8% margin restored on the product range by adjusting incoterms and packaging
OneChain dashboard — cost per piece calculation

How does OneChain centralize your data?

We eliminate blind spots without burdening your IT:

Smart collection: retrieve your flows via ERP integration (e.g. SAP) or automatic document reading (Packing List PDF)
Guaranteed quality: connect your ecosystem (suppliers, subsidiaries, forwarders) on a single platform to ensure data reliability
Real time: visualize your ROI opportunities and risks on customized dashboards

Rate increases, geopolitical crises or internal trade-offs… every action and external event is now measured.

OneChain dashboard — allocation tracking and custom reporting

In short, OneChain reporting is:

Informed decisions powered by comprehensive, reliable data

Objective management of your partners and costs

Your trusted partner: the data belongs to you